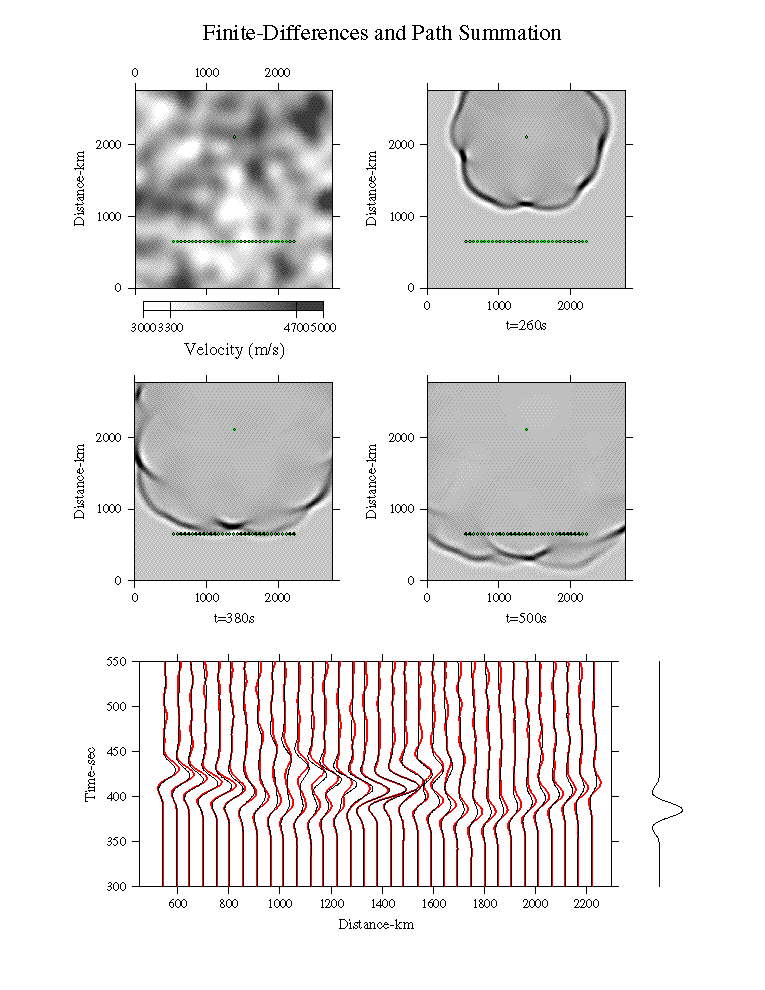
Comparison of Path-Summation and Finite Differences waveforms for a complicated, smooth, 2D model (top left). Three snapshots show the finite differences wavefield from a point source (green dot). The waveforms from 33 observation points (green line of dots) are shown at the bottom of the figure. There is a good agreement in amplitude and phase between the Path-Summation (thick red traces) and Finite Differences (thin black traces) waveforms for all of the principal signals. This agreement includes diffracted signals (i.e. the secondary arrival at time ~450sec and distance ~1000km, ), which cannot be modelled with geometrical ray theory. The noise in the coda of the Path-Summation waveforms indicates that the Monte-Carlo summation over paths has not yet fully converged.
Each Path-Summation waveform takes about 1/1000th of the time of the entire finite differences calculation, though the finite difference calculation produces the full response throughout the grid. (The set of 33 Path-Summation waveforms requires about 1/30th the time of the finite differences calculation.) The relative difference in calculation times between the two methods may be much larger in 3D.